CoreLogic Perth Index Withheld
CoreLogic's monthly report today included this passage:
The lift in housing values continues to be broad-based, with every capital city, apart from Darwin (-0.1%) recording a rise in values throughout the month, although it is important to note CoreLogic has withheld the Perth and Regional WA index results pending the resolution of a divergence from other housing market measurements in WA.
This blog noted this divergence back in June in this post:
https://www.graphsandstuff.com/blog/abs-vs-corelogic-index-march-2021
The divergence is quite substantial, with ABS showing Perth property above its 2017 values in Q1 2021, while CoreLogic was still 6% down at that time, per the chart below.
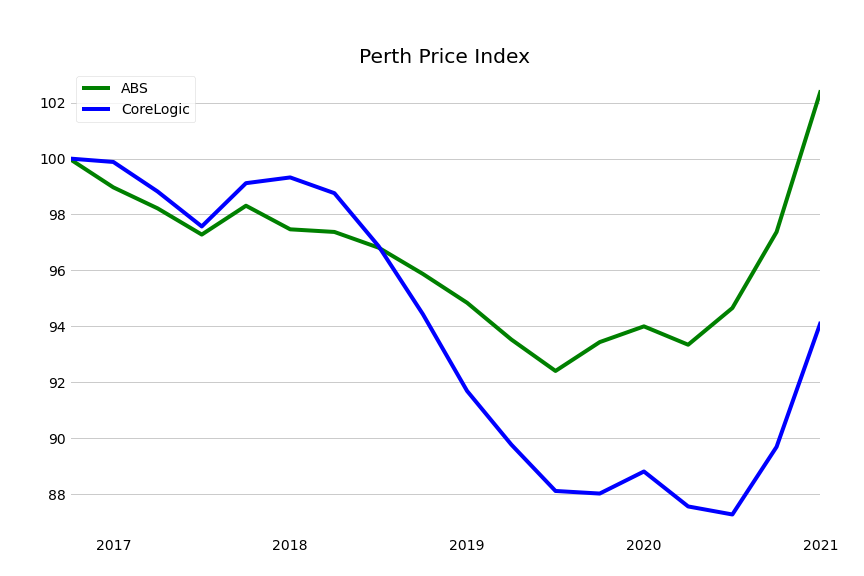
It was an uncharacteristic event, since the two indices tend to be very close together in aggregate and individual city values. It will be interesting to see what specifically could cause such a divergence between CoreLogic's hedonic methodology compared to ABS's stratified medians.