CoreLogic vs ABS - Residential Property Price Indices for Q1 2021
Today the Australian Bureau of Statistics released its Residential Property Price Indexes.
It's always interesting to compare its results against CoreLogic's Hedonic Index. Of course, the Hedonic Index is released daily, whereas the ABS is just releasing its index for the March quarter today - 12 weeks later.
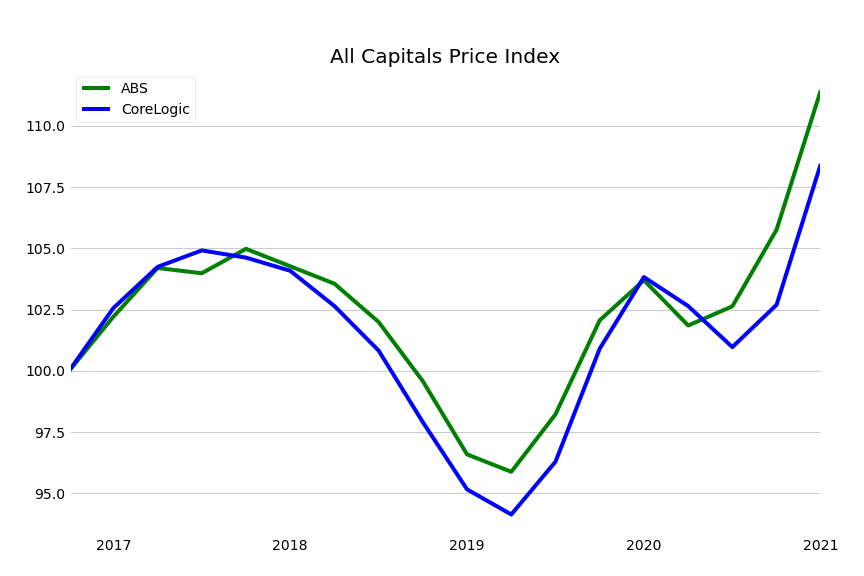
It's worth noting that the "all capitals" indexes are a bit different, since ABS includes Darwin, Hobart and Canberra, whereas CoreLogic just has the 5 major capitals - Sydney, Melbourne, Brisbane, Adelaide and Perth.
Sydney
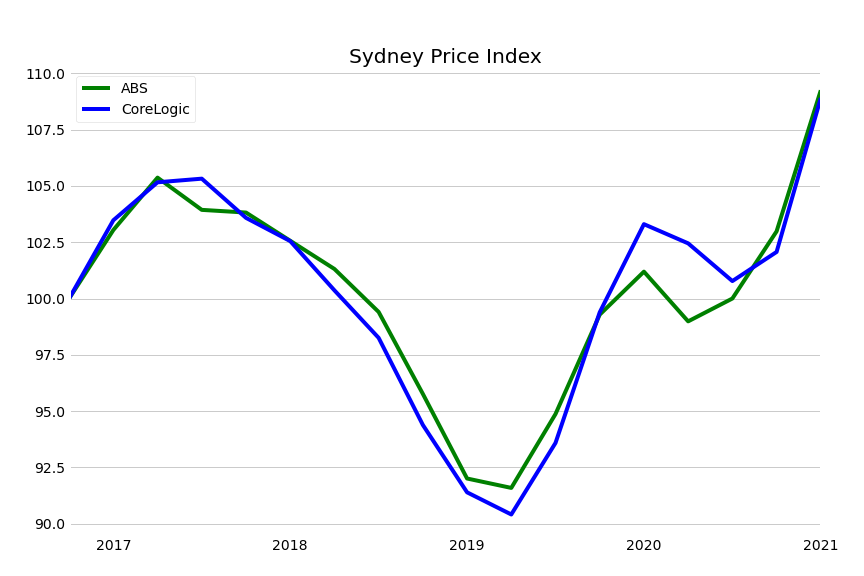
Virtually identical.
Melbourne
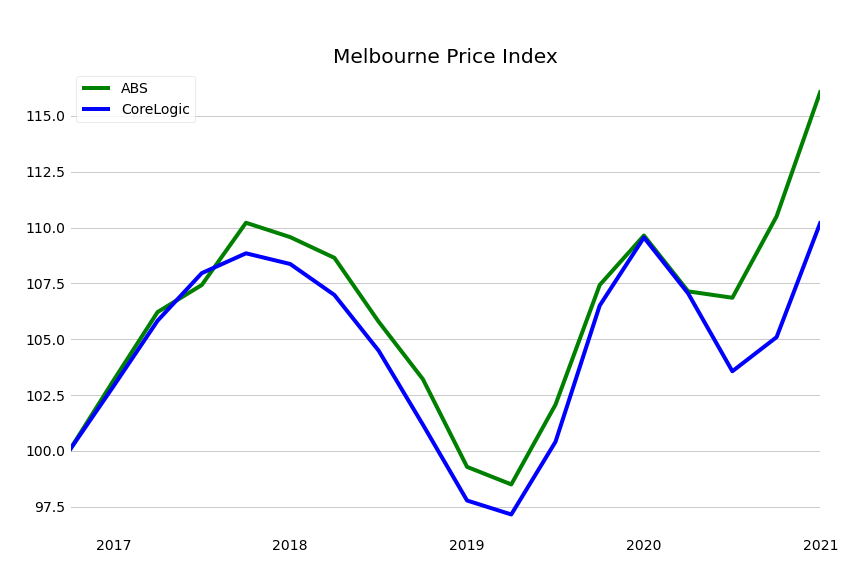
A bit of disagreement here in terms of the depth of the Covid fall and the pace of the subsequent recovery.
Brisbane
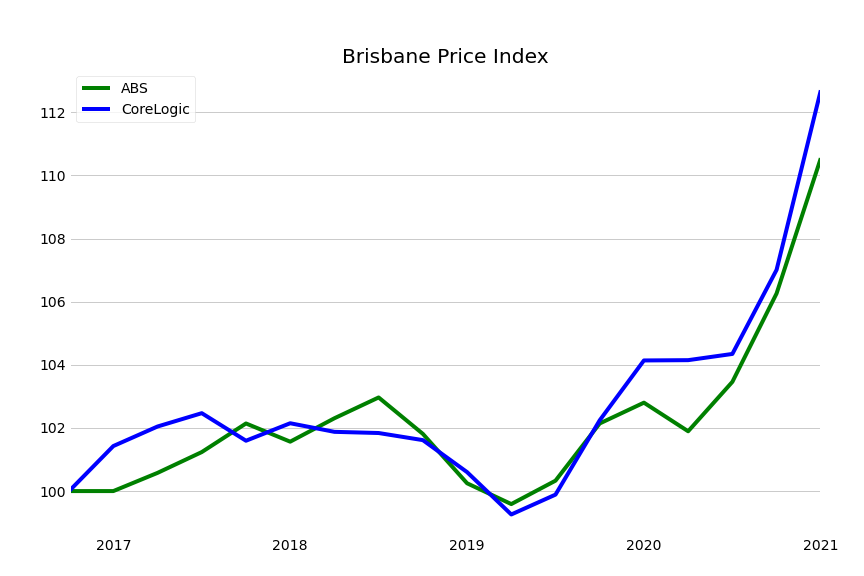
Okay.
Adelaide
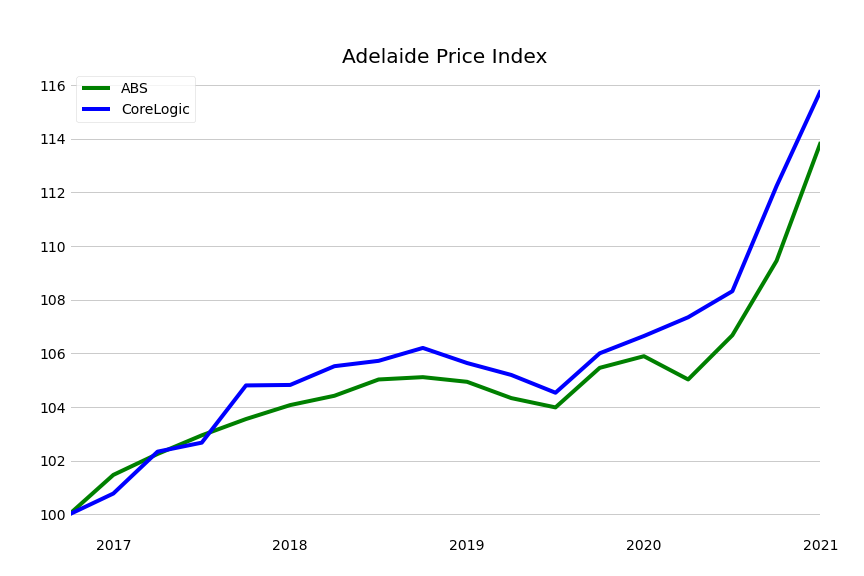
Same.
Perth
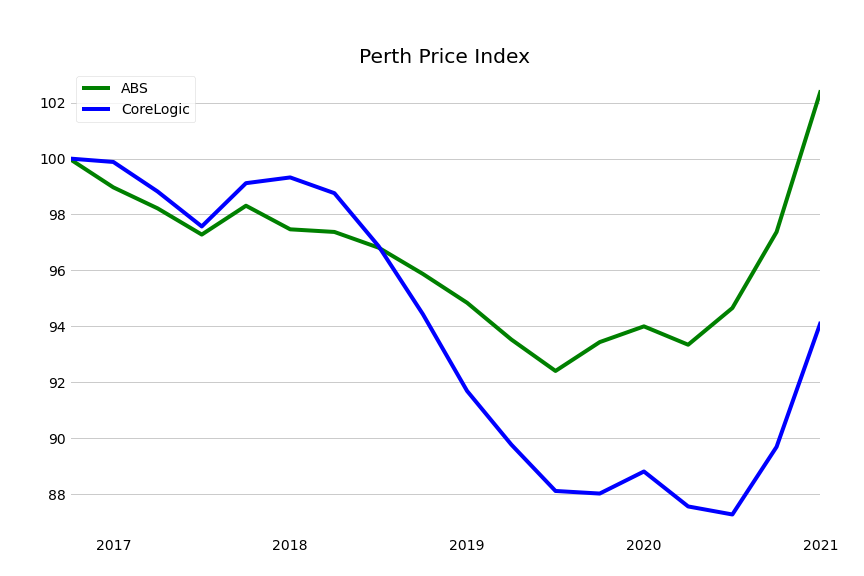
Of the lot, the Perth divergence is the most pronounced, with CoreLogic suggesting prices are still (as of end of March) 6% below the last quarter of 2016, and ABS saying they're already above.