Sydney Property Prices - 14 June 2021
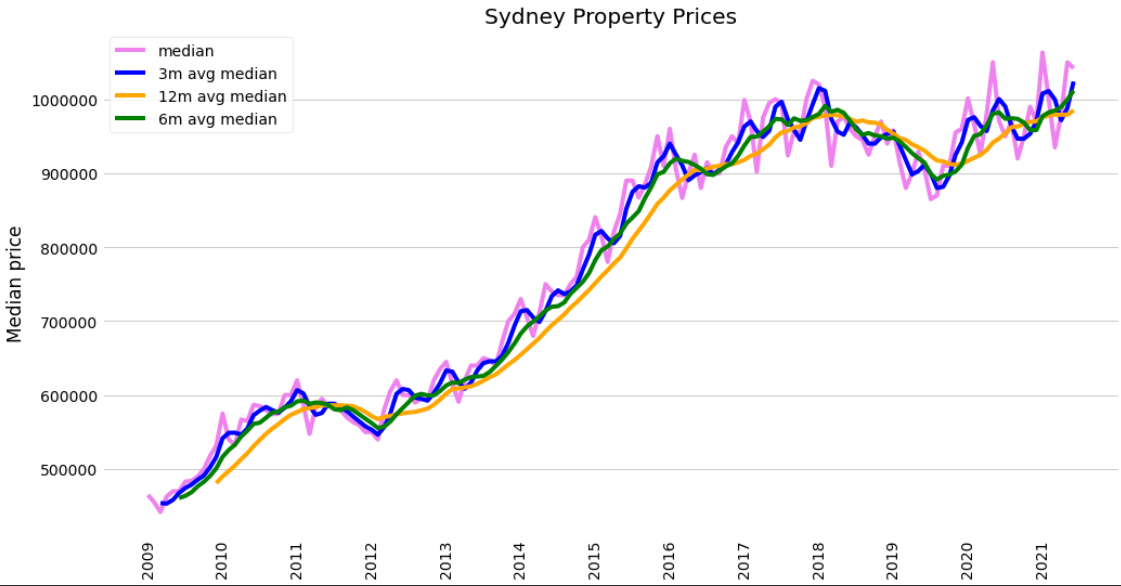
The chart above represents the price movements of Greater Sydney property. It certainly looks like prices have recovered back to their previous peak in 2017.
The other point of note is just how skittish medians are. There are dips around the start of the year and the mid-year. As volumes drop during those periods, so do the prices. Perhaps it's because the more expensive properties just don't get sold around low season? Or because if you do sell then, you really need to?
We'll have a look at those questions another time.
About This Image The chart is based on data from the NSW Valuer General and used pursuant to the Creative Commons Attribution 4.0 International License